
REITS ARE JUNK: -3.9% in September, +10.8% YTD

Updated: 10 hours ago

“What a piece of junk!” – Luke Skywalker, Star Wars
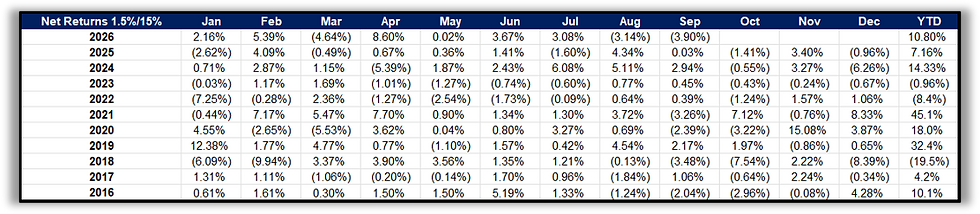
PERFORMANCE: Serenity Alternative Investments Fund I returned -3.9% net of fees in September vs the REIT index which returned -5.33%. Year to date (YTD) the fund has returned +10.8% vs +10.5% for the REIT index.
REITS GOT IT WHERE IT COUNTS: Despite lack-luster stock price performance, REIT NAV growth has accelerated in recent months.
0.5 PAST LIGHT SPEED: What is the impact of higher interest rates on Serenity’s largest holdings?
OUTRUN IMPERIAL STARSHIPS: Comparing REIT 10-year return targets versus the 10-year Treasury.
Luke Skywalker’s first impression of the Millenium Falcon was underwhelming, to say the least.
“She may not look like much, but she’s got it where it counts”, is Han Solo’s immediate rejoinder to a skeptical Skywalker, as they prepare to escape an imperial stormtrooper squadron and two awaiting Star Destroyers.
The quick lesson here is that sometimes it’s worth looking under the hood before immediately passing judgement. Which is important in the REIT market these days, because let’s face it, over the past 2 months, REITs look like junk.
But the recent move higher in interest rates and lower in REITs only tells one part of the story. As we have repeated in these pages throughout this year, REIT growth is MUCH more important to REIT cash flows than interest rates and this growth needs to be considered when evaluating REITs.
So what has REIT growth done as the sector has sold off?
Accelerated.
Huh? So REIT fundamentals are accelerating as the stocks are getting cheaper?
Yes.
That is not a story you will see on CNBC or hear from your local broker. The rates up, REITs down narrative is simple and easy, but it is about to be confronted with the cold hard economic reality that REITs are likely to beat and raise guidance en masse during Q3 earnings season (starting in 2 weeks).
Until then, REITs may continue to look like junk, but remember, REIT NAV growth just accelerated to +14% YoY. REITs got it where it counts (cash flow).
PERFORMANCE: -3.9% in September, +10.8% YTD
Serenity Alternative Investments Fund I returned -3.9% in September net of 1.5% and 15% fees and expenses with +92% net exposure versus the MSCI US REIT Index which returned -5.3%. On a YTD basis, the fund has returned +10.8% versus +10.5% for the REIT index. Over the past 5 years Serenity Alternatives Fund I has returned +7.3% annually, net of fees and expenses versus +4.3% for the REIT index.

The most profitable position in the fund for September was SBA Communications (SBAC), a short position which fell -15.6% during the month. SBAC is a cell-tower REIT with above average leverage relative to its peers. The cell-tower REITs tend to be high-duration (high correlation with bond yields), so naturally they were some of the worst performing REITs in September as interest rates moved higher. We have been short the cell-tower REITs for quite a while, as the companies have struggled with tenant issues and eroding pricing power. During the month we closed our SBAC short, however, to take some profits, and re-evaluate our thinking on the cell-tower sector. Serenity currently has no positions in cell-tower REITs.
The least profitable position in the fund in September was American Healthcare REIT (AHR), a long position which returned -6.7%. AHR remains one of Serenity’s largest long positions and best ideas. AHR performed relatively in-line with the market, and has sold-off with broader REITs, even as growth from acquisitions has increased in 2026 relative to 2025. Consensus estimates for cash flow per share (AFFO) for AHR for 2027 have risen +23% over the past year. This has made AHR significantly cheaper from a valuation perspective, now trading at +21.3x 2027 AFFO estimates, with a +20% 3-year AFFO CAGR. For a REIT growing at such a high clip, 21x AFFO is an extremely affordable valuation. Serenity remains long.
REITS GOT IT WHERE IT COUNTS: REIT NAV growth is accelerating.
While higher interest rates garner the lion’s share of REIT headlines, and REIT stock prices retreat, a less discussed indicator of REIT health is quietly defying the bearish narrative. That is Net Asset Value (NAV) growth, which represents the change in value of REIT underlying portfolios. As we have referenced in recent newsletters, NAV growth has accelerated meaningfully in 2026, beginning the year at around +2%, accelerating to +10% by July, and recently hitting +14% YoY. Said another way, analyst estimates of REIT portfolio values are almost +15% higher currently than they were last year, and this rate of change has accelerated in the last few months.
This is why REITs had posted such excellent performance in the first 7 months of this year, cash flows were growing, and interest rates, to that point, had moved up at a modest pace.
Things changed in September, when rates moved higher at a much more rapid pace, sending REITs -13% lower since their July peak.
Internally, however, REIT cash flows have only continued to improve, with supply headwinds fading across most REIT property types. The chart below tells a very straightforward story, that is, NAVs continue to move higher IN SPITE OF higher interest rates.

This is key because over long periods of time, REITs stock prices track NAVs much more closely than interest rates. Remember, REIT cash flows have a significant growth component, which makes them different than pure fixed-income proxies. While interest rates impact NAVs, so far, the 2026 rise in interest rates has done nothing to slow the pace of NAV growth for the broader REIT industry.
In my view, this is a bit of tell for the entire market. Could higher interest rates in fact just reflect a stronger growth outlook for the broader economy? That is not something you will read in the financial press, but REIT fundamentals support that theory strongly. RevPAR for Hotel REITs, the most economically sensitive of all REIT property types, is tracking in the high single digits, Self-Storage REITs are beginning to see NOI growth accelerate, and even the beleaguered Apartment REITs may be seeing signs of life in asking rents in the past few months. Again, these are not signs of an economy being de-railed by higher oil prices and interest rates. They are in fact the polar opposite. They are the signs of an accelerating economy, with improving growth which is driving rates higher.
Economic growth is the dog, and interest rates are the tail.
For this reason, Serenity has been loath to reduce our net exposure meaningfully as REITs have struggled over the past few months. Interest rates are literally the LONE negative we can find when underwriting the sector, and the recent move is very clearly now reflected in REIT valuations. Adding to the short book at this point would reflect an almost explicit bet on interest rates continuing to move higher rapidly, which is not something Serenity is comfortable handicapping.
The Bottom Line: Despite recent interest rate moves, REIT NAVs are growing faster than at any point since 2022. Serenity is focused on REIT cash flows, and therefore remains bullish on REITs, despite current rate headwinds. If rates move lower in 2027, REITs may be a coiled spring.
0.5 PAST LIGHT SPEED: Rising rates vs AHR.
Now the discussion of REIT NAVs at such a high level can be a bit esoteric, so let’s dig into a specific example. American Healthcare Realty (AHR) is one of Serenity’s largest long positions and best ideas. How do higher rates impact the AHR portfolio and value of its long-term cash flow stream?
Let’s start with AHR’s debt stack.
The chart below is from AHR’s Q2 2026 supplemental and shows the company’s debt maturity schedule over the next 4 years. As you can see, AHR has $890 million in mortgage loans outstanding and a $550 million term loan outstanding for a combined total of $1.4 billion in debt. For the sake of context, I estimate the value of AHR’s real estate portfolio (plus cash and the development pipeline) at +$11.6 billion. That puts the company’s leverage at +12.4% on a debt to asset value basis.

You will notice the weighted average interest rate on this debt is +4.23%. Current BAA bond yields are closer to +6.75%, so it is possible that AHR will face significant refinancing headwinds over the next few years if interest rates remain at current levels.
But let’s put some math behind it. Interest of +4.23% on $1.4 billion in debt is $60.9m each year. This equates to about $0.31 per share in yearly interest expense for AHR. Now let’s mark that entire debt stack to market (a very penalizing assumption). At +6.5% rates, interest expense jumps to $93.6m, a difference of $33m, or $0.17 per share.
If AHR somehow had to refinance their entire debt stack in 2027, it would have a $-0.17 impact on their earnings (FFO). That would reduce FFO by -6.8%, from $2.44 to $2.28. This, however, is still higher than 2026 FFO of $2.13, meaning FFO growth for 2027 would come in at +6.8%, instead of +14.6%.
So just to recap, if AHR had to re-finance its entire debt stack tomorrow, it would still grow FFO at +6.8% in 2027.
A more realistic assumption would be to spread that $0.17 impact over the next 4-6 years as the company’s debt matures, which would dampen the impact to $0.03-$0.05 per year, a +1.6% drag on growth each year at the midpoint. Remember this is in comparison to a portfolio that has same-store NOI growth of +11-13%, meaning the impact of growth on AHR’s cash flows is roughly 10x that of the impact of higher interest rates.
A few caveats here are worth mentioning. First, AHR has a very low-levered balance sheet, so interest rate impacts are obviously going to be mild at +12% debt/asset value. The REIT industry tends to run closer to +30% leverage, so other REITs may see a more substantial impact. There are also secondary considerations, the most important of which is that higher interest rates impact the multiples investors are willing to pay for REITs, so the impact of higher rates may not so much be on REIT cash flows as it is on REIT’s perception and valuation in the broader market.
That being said, for long-term cash-flow oriented investors <cough> Serenity <cough>, the recent move in interest rates, particularly for high-quality REITs growing their cash flows at a rapid rate, is truly negligible.
The Bottom Line: Interest rates do impact REIT cash flows, but for fast growing, low levered portfolio’s like AHR’s, the impact is likely to reduce growth by 1-2% per year. Compared to NAV growth that is averaging closer to +20%/year this impact is very manageable.
OUTRUN IMPERIAL STARSHIPS: 10-year treasuries vs REITs
Now for the opportunity cost analysis. One common investor question has to do with the opportunity cost of buying REITs. Said simply, why buy REITs when I can get a +5.3% yield on a 10-year treasury note?
On a forward-looking basis, this is a straightforward question. An investor buying a 10-year note right now knows with certainty what their annual return will be for the next 10 years…~+5.3% as of this writing.
How does this compare to REITs? We can tackle this question in 3 ways.
First, let’s look at the assumptions REITs themselves use when deploying capital. As institutional buyers, REITs tend to target 10-year IRR’s in the +7%-7.5% range on an un-levered basis. Said another way, they expect to earn +7%-7.5% on every dollar they invest before leverage. Add in +30% leverage, and this total return estimate increases to +9.43% (assuming +7.25% un-levered returns). Since 2000, what have REIT returns averaged over 10-year periods? +10.04%, which is a very close approximation of their underwriting assumptions.
So simply examining history would suggest that REITs earn a fairly significant return premium relative to even +5.3% 10-year yields.
We can also examine Serenity’s historical returns, since the fund has existed for over a decade. As displayed above, since inception (2016), Serenity Fund I has delivered gross returns of +12.6% annually (+9.2% net of +1.5% and +15% fees), versus +6.3% for the REIT index. That is +290 basis points in yearly excess returns over a 10-year time period (versus the REIT index), and again, well above the prospective returns on the 10-year treasury of +5.3%.
Now for the (in my opinion) most compelling comparison. Let’s go back to AHR from our example above and compare that cash flow stream to that of a 10-year note. AHR on my numbers, trades at a 2026 implied cap rate of +4.75%. That is effectively the real estate yield an investor can expect from investing in AHR. Now, as we mentioned above, AHR is growing its same-store NOI at +11-13% in 2026. Additionally, AHR has closed almost $2 billion in acquisitions year to date and has a nearly $200m development pipeline. All told, AHR is set to grow its NOI by +28% in 2026.
Let’s be conservative and assume that AHR’s growth normalizes over the next 5 years and settles in at +2.5% after 2031. If growth falls from +20% to +2.5% by 2031, a hypothetical 10-year CAGR of +7.31% is very possible. We can then add this to our +4.75% current NOI yield to get a +12.05% 10-year expected IRR.
This is REITs secret recipe. 10-year treasury yields do not grow. REIT cash flows, however, can compound at high single digit growth rates over 10-year periods. On a $1 million investment, that’s the difference between having +$1.67 million 10 years from now from investing in treasuries, or +$3.12 million from investing in REITs like AHR.
The Bottom Line: 10-year treasury yields are extremely safe but have no growth. REITs, on the other hand, tend to grow their cash flow over time, in many instances at attractive, high single-digit growth rates. This growth compounds, and historically awards investors with a premium return albeit at higher risk.
YOU’RE ALL CLEAR KID
Interest rates up, REITs down is a simple and straightforward way to view recent REIT market moves. It may, however, ignore the economic reality that REIT NAV estimates continue to increase at the fastest pace in 4 years.
Looking forward to 2027, there are a wide range of REITs growing their cash flows at +10-15% CAGR’s that trade at reasonable valuations, have great management teams, and extremely healthy, low-levered balance sheets.
Serenity’s strategy is designed to find these opportunities, and our clients will benefit as REIT cash flows continue to grow.
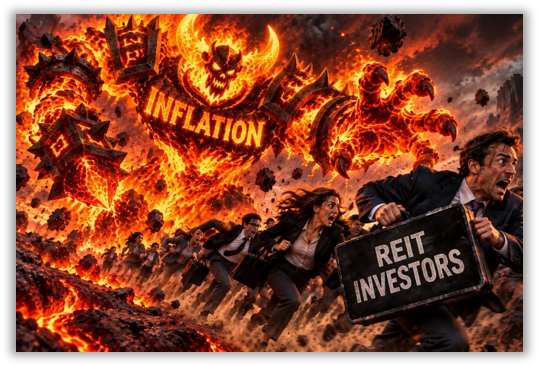
In the battle between REIT investors and higher interest rates, the key to victory is finding vehicles in which growth can out-run changes in the imperial 10-year yield.
2027 Kessel run in under 12 parsecs,
Martin D Kollmorgen, CFA
CEO and Chief Investment Officer
Serenity Alternative Investments


*All charts generated using data from Bloomberg LP, S&P Global, and Serenity Alternative Investments
DISCLAIMER: This document is being furnished by Serenity Alternative Investment Management, LLC (“Manager”), the investment manager of the private investment fund, Serenity Alternative Investments Fund I, LP (the “Fund”), solely for use in connection with consideration of an investment in the Fund by prospective investors. The statements herein are based on information available on the date hereof and are intended only as a summary. The Manager has been in operation since 2016 and the Fund commenced operations on January 14th. The information provided by the Manager is available only to those investors qualifying to invest in the Fund. By accepting this document and/or attachments, you agree that you or the entity that you represent meet all investor qualifications in the jurisdiction(s) where you are subject to the statutory regulations related to the investment in the type of fund described in this document. This document may not be reproduced or distributed to anyone other than the identified recipient’s professional advisers without the prior written consent of the Manager. The recipient, by accepting delivery of this document agrees to return it and all related documents to the Manager if the recipient does not subscribe for an interest in the Fund. All information contained herein is confidential. This document is subject to revision at any time and the Manager is not obligated to inform you of any changes made. No statement herein supersedes any statement to the contrary in the Fund’s confidential offering documents.
The information contained herein does not constitute an offer to sell or the solicitation of an offer to purchase any security or investment product. Any such offer or solicitation may only be made by means of delivery of an approved confidential offering memorandum and only in those jurisdictions where permitted by law. Prospective investors should inform themselves and take appropriate advice as to any applicable legal requirements and any applicable taxation and exchange control regulations in the countries and/or states of their citizenship, residence or domicile which might be relevant to the subscription, purchase, holding, exchange, redemption or disposal of any investments. The information contained herein does not take into account the particular investment objectives or financial circumstances of any specific person who may receive it. Before making an investment, prospective investors are advised to thoroughly and carefully review the offering memorandum with their financial, legal and tax advisers to determine whether an investment such as this is suitable for them.
There is no guarantee that the investment objectives of the Fund will be achieved. There is no secondary market for interests and none is expected to develop. You should not make an investment unless you have a long term holding objective and are prepared to lose all or a substantial portion of your investment. An investment in the Fund is speculative and involves a high degree of risk. Opportunities for withdrawal and transferability of interests are restricted. As a result, investors may not have access to capital except according to the terms of withdrawal specified within the confidential offering memorandum and other related documents. The fees and expenses that will be charged by the Fund and/or its Manager may be higher than the fees and expenses of other investment alternatives and may offset profits.
With respect to the present document and/or its attachments, the Manager makes no warranty or representation, whether express or implied, and assumes no legal liability for the accuracy, completeness or usefulness of any information disclosed. Certain information is based on data provided by third-party sources and, although believed to be reliable, it has not been independently verified and its accuracy or completeness cannot be guaranteed and should not be relied upon as such. Performance information and/or results, unless otherwise indicated, are un-audited and their appearance in this document reflects the estimated returns net of all expenses and fees. Investment return and the principal value of an investment will fluctuate and may be quite volatile. In addition to exposure to adverse market conditions, investments may also be exposed to changes in regulations, change in providers of capital and other service providers.
The Manager does not accept any responsibility or liability whatsoever caused by any action taken in reliance upon this document and/or its attachments. The private investment fund described herein has not been registered under the Investment Company Act of 1940, as amended, and the interests therein have not been registered under the Securities Act of 1933, as amended (the “1933 Act”), or in any state or foreign securities laws. These interests will be offered and sold only to “Accredited Investors” as such term is defined under federal securities laws. The Manager assumes that by acceptance of this document and/or attachments that the recipient understands the risks involved – including the loss of some or all of any investment that the recipient or the entity that he/she represents. An investment in the Fund is not suitable for all investors.
This material is for informational purposes only. Any opinions expressed herein represent current opinions only and while the information contained herein is from sources believed reliable there is no representation that it is accurate or complete and it should not be relied upon as such. The Manager accepts no liability for loss arising from the use of this material. Federal and state securities laws, however, impose liabilities under certain circumstances on persons who act in good faith and nothing herein shall in any way constitute a waiver or limitation of any rights that a client may have under federal or state securities laws.
The performance representations contained herein are not representations that such performance will continue in the future or that any investment scenario or performance will even be similar to such description. Any investment described herein is an example only and is not a representation that the same or even similar investment scenarios will arise in the future or that investments made will be profitable. No representation is being made that any investment will or is likely to achieve profits or losses similar to those shown. In fact, there are frequently sharp differences between prior performance results and actual Fund results.
References to the past performance of other private investment funds or the Manager are for informational purposes only. Other investments may not be selected to represent an appropriate benchmark. The Fund’s strategy is not designed to mimic these investments and an individual may not be able to invest directly in each of the indices or funds shown. The Fund’s holdings may vary significantly from these referenced investments. The historical performance data listed is for informational purposes only and should not be construed as an indicator of future performance of the Fund or any other fund managed by the Manager. The performance listed herein is unaudited, net of all fees. YTD returns for all indices are calculated using closing prices as of Jan 14th, the first day of the funds operation. Data is subject to revision.
Certain information contained in this material constitutes forward-looking statements, which can be identified by the use of forward-looking terminology such as “may,” “will,” “should,” “expect,” “anticipate,” “target,” “project,” “estimate,” “intend,” “continue,” or “believe,” or the negatives thereof or other variations thereon or comparable terminology. Such statements are not guarantees of future performance or activities. Due to various risks and uncertainties, actual events or results or the actual performance of the Fund described herein may differ materially from those reflected or contemplated in such forward-looking statements.
Our investment program involves substantial risk, including the loss of principal, and no assurance can be given that our investment objectives will be achieved. Among other things, certain investment techniques as described herein can, in certain circumstances, maximize the adverse impact to which the Fund’s investment portfolio may be subject. The Fund may use varying degrees of leverage and the use of leverage can lead to large losses as well as large gains. Investment guidelines and objectives may vary depending on market conditions.


Comments