
UNDER THE RADAR REITS: +0.06% in May, +11.5% YTD


“BUELLER?...BUELLER?...BUELLER?" – Ferris Bueller's Day Off
PERFORMANCE: Serenity Alternative Investments Fund I returned +0.06% net of fees in May vs the REIT index which returned -0.2%. Year to date (YTD) the fund has returned +11.5% vs +14.1% for the REIT index.
BUELLER…BUELLER? Chinese Data Center company GDS Holdings (GDS) has flown under the radar amidst the Data Center craze. Investors might be sleeping on a new DC giant.
ANYONE…ANYONE? Iron Mountain (IRM) is a company firing on all cylinders, but it still trades at a REIT average multiple.
SAVE FERRIS: American Healthcare Realty (AHR) and Welltower (WELL) could post +100% earnings growth by 2030…
The stock market loves shiny objects.
AI memory players, quantum computing companies, $1 trillion AI behemoths.
All these types of companies can triple or 10x their valuations if they find the right market moment.
Anyone want to buy boring, cash flow positive, 10-15% earnings compounders?
Bueller…Bueller…Bueller?
With investors mostly focused on speculation in 2026, there are a swath of high-quality, cash-compounding REITs and real estate companies that are almost completely ignored.
Over time, these are the types of companies that can generate +20-30% yearly returns over full cycles, from businesses that are profitable and proven, with cash flows generated from high-quality real estate.
These companies make you rich slowly, but with a high degree of certainty.
I know +20% growth may seem boring in 2026, but some of us are old enough to remember when double-digit compound cash flow growth was exciting!
Maybe I’m a dinosaur in this market.
Or maybe our portfolio is set to grow and re-invest its cash flow at +12-15% per year over the next decade.
Anyone interested in the Warren Buffet approach? Anyone?
Bueller?...Bueller?
PERFORMANCE: +0.06% in May, +11.5% YTD
Serenity Alternative Investments Fund I returned +0.06% in May net of fees and expenses with +100% net exposure versus the MSCI US REIT Index which returned -0.20%. On a YTD basis, the fund has returned +11.5% versus +14.1% for the REIT index. Over the past 5 years Serenity Alternatives Fund I has returned +8.0% annually, net of fees and expenses versus +5.8% for the REIT index.

The most profitable position in the fund in May was Host Hotels (HST), a long position which returned +8.76%. Host is one of the highest quality Lodging portfolios in the US, has a bulletproof balance sheet, and is run by a very respected management team. As we have written in previous newsletters, Lodging is off to its best yearly start since 2015. Host beat earnings guidance in Q1 and raised full year guidance to reflect current strength and continued RevPAR acceleration. Serenity remains long Host and overweight the Lodging REITs going into what could be the strongest summer for Lodging in over a decade.
The worst performing position in the fund in May was GDS Holdings (GDS), a long position which returned -16.15% during the month. GDS is a Chinese Data Center company and in Q1 it failed to account for a period of slower activity which negatively affected 2026 earnings guidance. Investors were disappointed and the stock sold off hard towards the end of May.
While missing guidance is never positive, I was frankly quite surprised at the negative reaction investors had to GDS’ quarterly results. I have been covering Data Center REITs since 2010, and apart from the guidance issue, this was one of the best quarters for a Data Center company I have seen in a long time. GDS has seen leasing accelerate rapidly over the past few quarters, with a backlog of cash flow in the pipeline that will send the company’s NOI and EBITDA rapidly higher over the next two years. In Q1, the company had one of the strongest bookings quarters ever. Suffice it to say, Serenity used the recent draw-down in GDS shares as a buying opportunity. We remain long the name, and it is quickly moving up the ranks as one of our best Long ideas.
GDS: Bueller…?
Over the last month I’ve casually canvassed the investing community for thoughts on GDS, and the lack of interest has surprised me. I would have expected a major Data Center player in this market to attract much more attention, but for various reasons, it seems that GDS still flies under many investors’ radars. Some were burned when the stock fell significantly in 2022, some do not seem interested in Chinese companies, and some simply don’t seem to know it exists. This lack of coverage, for Serenity, could be an incredible opportunity.
As I mentioned above, GDS sold off on Q1 earnings, despite reporting extremely strong fundamentals. This is where being a long-term investor can have huge advantages and illustrates the short-term nature of GDS’ current investor base. While other hedge funds focus intensely on quarterly earnings beats and misses, Serenity can take a long-term perspective, and benefit from quarterly dislocations that may occur amidst positive long-term trends.
To contextualize what happened during the quarter, let’s look at GDS’ bookings velocity over the past few years.
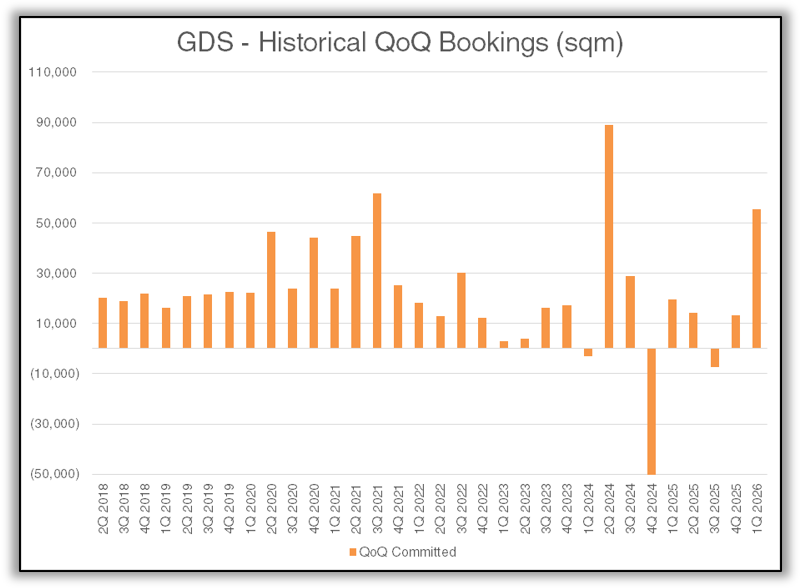
The chart above shows QoQ square meters of bookings for GDS going back to 2018. You will notice that Q1 of 2026 is the second highest bar on this chart, at +55,379 sqm of bookings for the quarter. This was nearly 3x the full period average of +18,000 per quarter.
This represented +200MW of signed Data Center leases in Q1, with the company disclosing an additional +140 MW has been signed since the end of the quarter. This is on a base of about 1.6GW, meaning the company has increased the leased power base of the company by +21% so far in the first 5 months of 2026 (+340MW on +1.6GW base).
This is a massive acceleration in growth that will play out over the next 24 months, much of which was generated in the first 5 months of this year. If GDS can maintain this pace, they will easily hit the high end of their targeted 500-800MW in yearly leasing, which they laid out in late 2025. Again, GDS only had a base powered portfolio of 1.6 GW coming into this year. Hitting +800MW in yearly leasing would be +50% annual growth in the size of the GDS portfolio.
From a valuation perspective, the market does not seem to have sniffed this out. Using Bloomberg consensus estimates, GDS trades at +11.2x 2028 EBITDA, which assumes EBITDA growth of +7.7% in 2027, and +16.4% in 2028. I think these growth rates are far too conservative, with my 2028 EBITDA estimate about +15% higher than consensus, meaning on Serenity’s numbers, GDS trades at less than +10x 2028 EBITDA.
This compares to an average 2028 EBITDA multiple of +15.8x for the other Data Center companies, none of which I believe will grow as fast as GDS.
So just to recap, GDS just had one of its best bookings quarters ever, it already has leases on the books for a phenomenal Q2, and the company, by its own estimates, could double the size of its powered portfolio by late 2028, and it trades at a nearly +5 turn discount to peers on 2028 EBITDA. And this stock has fallen -27% from its May highs…
Something does not add up here, and my bet is that investors are not doing the work that they should be on the leasing pipeline of GDS. Earnings miss or no earnings miss, Serenity is happy to own a Data Center portfolio with industry leading growth trading at the lowest multiple in its industry. We believe GDS could re-rate significantly higher over the next 24 months, as investors realize earnings and cash flow are about to increase significantly.
IRON MOUNTAIN: The Hyperscaler’s best friend…
In another part of Data Center land, Iron Mountain (IRM) continues to knock the cover off the ball, while generating mostly shrugs from the broader REIT investor universe. I spent the early part of last week at the REIT industry’s largest yearly conference in New York, pitching Iron Mountain to anyone with a set of ears. To my surprise, many well capitalized investors still don’t get the IRM story.
The company is complex and takes a good amount of work to understand, but this fact remains; Iron Mountain has grown its AFFO (cash flow) at an +11.27% CAGR over the last 5 years and a +13.9% CAGR over the last 3 years. Despite this fact, the company trades at +19x 2027 estimated cash flow, well below the multiples of most high-growth REITs.
Iron Mountain’s growth story is also multi-pronged. The company’s Data Center business is leading the way, with revenue growth in Data Centers exceeding +20% every quarter since 2021. The chart below shows Data Center revenue growth, as well as total organic growth for the company’s other “storage” offerings, which are the bulk of Iron Mountains revenues.

The takeaway from this chart is that Iron Mountain is not dependent on Data Center growth to generate strong NOI and earnings growth. The company’s core storage business has grown organically at an average rate of +9.5% since 2021, which would by itself be some of the best organic growth in all of REITs.
And Iron Mountain continues to diversify. The company has recently built a business called “Asset Lifecycle Management (ALM)” from sub $100 million in revenue a few years ago to almost $1 billion in 2025. ALM consists of Iron Mountain helping both enterprise customers and hyperscale Data Center tenants dispose of old computing hardware. Sound boring? It sure is, but the company believes it will be a multibillion-dollar business within a few years and will require almost no capital to scale to that level.
Meeting with Iron Mountain, it’s difficult to find pieces of their business that do not have an incredibly bullish outlook over the next 3-5 years. Data Centers growing at a +30% clip, +10% organic growth in their core storage business, and an ALM vertical that could add billions in revenue in the near future. At +19x cash flow, Iron Mountain represents a bargain in our eyes within the cohort of +12-15% multi-year earnings growth REITs (of which there are few).
AHR: +100% earnings growth?
Speaking of multi-year earnings growth stories…
I was also able to spend some time with American Healthcare REIT (AHR) last week at the NAREIT conference, one of our favorite longs, and best performing portfolio allocations over the past year plus. AHR sits right in the crosshairs of the largest demographic shift in our country’s history: the aging of the baby boomers.
Let’s pause for a second.
I cannot stress enough how important it is to have Seniors Housing REITs in your portfolio.
This is not A REIT bull market…this might be THE REIT bull market.
Welltower (WELL), another Serenity long position and the industry leader in Seniors Housing…just quietly raised their long-term earnings growth target to +15%. That’s a long-term (5-10 years or longer) outlook that is…incredible, unprecedented, astronomical, gargantuan…pick your adjective. That does not mean +15% for a few years, then settling back to +2-5% long term, which is what most REIT bull markets look like. This means multiple years of +20% earnings growth (2026 will likely be year 3 of this level of growth), which then reverts to +10-15% around 2030.
At earnings growth rates like this, it would not be surprising to see Welltower, and potentially AHR grow their earnings by +100% by 2030.
Doubling earnings in 4-5 years does not happen in the REIT industry, but in this instance, I believe it is not only possible…but highly likely.
Back to AHR.
While Welltower has the best cost of capital in Seniors Housing and the most sophisticated operating platform, it is also the largest company in the REIT universe at +$146 billion in market cap. At that size, it becomes more difficult to move the needle using acquisitions and development, relative to a company like AHR, at +$10 billion.
Year to date in 2026, AHR has made over $1 billion in acquisitions, expanding their portfolio by just under +10%. Additionally, the company has guided to full-portfolio NOI growth of +9-12%, which is likely conservative. Consensus expects AFFO (cash flow) growth of +17.8% in 2026, and +13.6% in 2027. Those numbers are both too low, and I would expect AHR to achieve closer to +22% growth in 2026 and +18-20% growth in 2027.
With both AHR and WELL falling from recent highs in the past month, Serenity has taken this opportunity to increase our Seniors Housing exposure after meeting with both companies, confident in the long-term earnings and NAV growth potential that they offer.
AHR could double their earnings by 2030 and the stock trades at +21x forward cash-flow estimates. Anyone else think this is a bargain? Bueller?...Bueller?…Bueller?
LIFE MOVES PRETTY FAST
My career in REITs has been built on finding high growth REITs that the market does not appreciate.
When I listen to GDS’ conference calls…there is a conspicuous lack of REIT sell-side coverage, meaning not many REIT investors are paying attention. GDS could double the size of their portfolio in the next few years…and it trades at a -50% discount to the large US Data Center REITs.
When I pitch Seniors Housing REITs to non-REIT investors…they mostly yawn. In the meantime, these companies could double their earnings by 2030…which is when the demographic bull market accelerates.
Iron Mountain is more likely to generate interest as a SHORT with un-informed investors…but is likely to compound its cash flows at +10-15% for at least the next 5 years.
Maybe I’m crazy and the market is efficient.
But maybe…just maybe, these companies are badly under-appreciated by investors and could generate spectacular returns over the next 3-5 years.
Anyone find that interesting? Anyone?
Bueller…Bueller…Bueller?
Martin D Kollmorgen, CFA
CEO and Chief Investment Officer
Serenity Alternative Investments


*All charts generated using data from Bloomberg LP, S&P Global, and Serenity Alternative Investments
DISCLAIMER: This document is being furnished by Serenity Alternative Investment Management, LLC (“Manager”), the investment manager of the private investment fund, Serenity Alternative Investments Fund I, LP (the “Fund”), solely for use in connection with consideration of an investment in the Fund by prospective investors. The statements herein are based on information available on the date hereof and are intended only as a summary. The Manager has been in operation since 2016 and the Fund commenced operations on January 14th. The information provided by the Manager is available only to those investors qualifying to invest in the Fund. By accepting this document and/or attachments, you agree that you or the entity that you represent meet all investor qualifications in the jurisdiction(s) where you are subject to the statutory regulations related to the investment in the type of fund described in this document. This document may not be reproduced or distributed to anyone other than the identified recipient’s professional advisers without the prior written consent of the Manager. The recipient, by accepting delivery of this document agrees to return it and all related documents to the Manager if the recipient does not subscribe for an interest in the Fund. All information contained herein is confidential. This document is subject to revision at any time and the Manager is not obligated to inform you of any changes made. No statement herein supersedes any statement to the contrary in the Fund’s confidential offering documents.
The information contained herein does not constitute an offer to sell or the solicitation of an offer to purchase any security or investment product. Any such offer or solicitation may only be made by means of delivery of an approved confidential offering memorandum and only in those jurisdictions where permitted by law. Prospective investors should inform themselves and take appropriate advice as to any applicable legal requirements and any applicable taxation and exchange control regulations in the countries and/or states of their citizenship, residence or domicile which might be relevant to the subscription, purchase, holding, exchange, redemption or disposal of any investments. The information contained herein does not take into account the particular investment objectives or financial circumstances of any specific person who may receive it. Before making an investment, prospective investors are advised to thoroughly and carefully review the offering memorandum with their financial, legal and tax advisers to determine whether an investment such as this is suitable for them.
There is no guarantee that the investment objectives of the Fund will be achieved. There is no secondary market for interests and none is expected to develop. You should not make an investment unless you have a long term holding objective and are prepared to lose all or a substantial portion of your investment. An investment in the Fund is speculative and involves a high degree of risk. Opportunities for withdrawal and transferability of interests are restricted. As a result, investors may not have access to capital except according to the terms of withdrawal specified within the confidential offering memorandum and other related documents. The fees and expenses that will be charged by the Fund and/or its Manager may be higher than the fees and expenses of other investment alternatives and may offset profits.
With respect to the present document and/or its attachments, the Manager makes no warranty or representation, whether express or implied, and assumes no legal liability for the accuracy, completeness or usefulness of any information disclosed. Certain information is based on data provided by third-party sources and, although believed to be reliable, it has not been independently verified and its accuracy or completeness cannot be guaranteed and should not be relied upon as such. Performance information and/or results, unless otherwise indicated, are un-audited and their appearance in this document reflects the estimated returns net of all expenses and fees. Investment return and the principal value of an investment will fluctuate and may be quite volatile. In addition to exposure to adverse market conditions, investments may also be exposed to changes in regulations, change in providers of capital and other service providers.
The Manager does not accept any responsibility or liability whatsoever caused by any action taken in reliance upon this document and/or its attachments. The private investment fund described herein has not been registered under the Investment Company Act of 1940, as amended, and the interests therein have not been registered under the Securities Act of 1933, as amended (the “1933 Act”), or in any state or foreign securities laws. These interests will be offered and sold only to “Accredited Investors” as such term is defined under federal securities laws. The Manager assumes that by acceptance of this document and/or attachments that the recipient understands the risks involved – including the loss of some or all of any investment that the recipient or the entity that he/she represents. An investment in the Fund is not suitable for all investors.
This material is for informational purposes only. Any opinions expressed herein represent current opinions only and while the information contained herein is from sources believed reliable there is no representation that it is accurate or complete and it should not be relied upon as such. The Manager accepts no liability for loss arising from the use of this material. Federal and state securities laws, however, impose liabilities under certain circumstances on persons who act in good faith and nothing herein shall in any way constitute a waiver or limitation of any rights that a client may have under federal or state securities laws.
The performance representations contained herein are not representations that such performance will continue in the future or that any investment scenario or performance will even be similar to such description. Any investment described herein is an example only and is not a representation that the same or even similar investment scenarios will arise in the future or that investments made will be profitable. No representation is being made that any investment will or is likely to achieve profits or losses similar to those shown. In fact, there are frequently sharp differences between prior performance results and actual Fund results.
References to the past performance of other private investment funds or the Manager are for informational purposes only. Other investments may not be selected to represent an appropriate benchmark. The Fund’s strategy is not designed to mimic these investments and an individual may not be able to invest directly in each of the indices or funds shown. The Fund’s holdings may vary significantly from these referenced investments. The historical performance data listed is for informational purposes only and should not be construed as an indicator of future performance of the Fund or any other fund managed by the Manager. The performance listed herein is unaudited, net of all fees. YTD returns for all indices are calculated using closing prices as of Jan 14th, the first day of the funds operation. Data is subject to revision.
Certain information contained in this material constitutes forward-looking statements, which can be identified by the use of forward-looking terminology such as “may,” “will,” “should,” “expect,” “anticipate,” “target,” “project,” “estimate,” “intend,” “continue,” or “believe,” or the negatives thereof or other variations thereon or comparable terminology. Such statements are not guarantees of future performance or activities. Due to various risks and uncertainties, actual events or results or the actual performance of the Fund described herein may differ materially from those reflected or contemplated in such forward-looking statements.
Our investment program involves substantial risk, including the loss of principal, and no assurance can be given that our investment objectives will be achieved. Among other things, certain investment techniques as described herein can, in certain circumstances, maximize the adverse impact to which the Fund’s investment portfolio may be subject. The Fund may use varying degrees of leverage and the use of leverage can lead to large losses as well as large gains. Investment guidelines and objectives may vary depending on market conditions.



Comments